How To Read A Mortgage Loan Estimate
Do you know how to read a Loan Estimate?
If you don’t, that’s pretty normal. We work with people all the time who’ve bought and sold numerous homes and rental properties who really still aren’t sure how to compare apples to apples when reviewing loan estimates.
It’s a critical skill for anyone buying or selling real estate so you can make an informed and educated decision and can choose the financing option that serves you best.
The most common mistake is just focusing on the interest rate. That’s half the picture. It’s like walking around with one eye closed. Sure, you can see, but your depth perception, among other things, is off.
You have to understand not only the interest rate, but what is that rate costing you? Or, are you getting paid to take that interest rate?
The Consumer Financial Protection Bureau has this explainer: https://www.consumerfinance.gov/owning-a-home/loan-estimate/ but I find it glosses over some of the key comparison tools, so here’s my tutorial, using some real world examples to show you side by side.
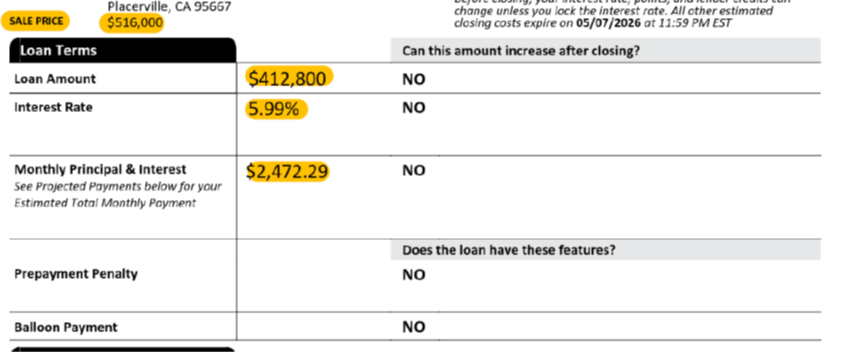
Page 1 of the Loan Estimate gives you a summary of your transaction. There are three sections to the summary. Loan Terms, Projected Payments and Closing Costs.
Here’s a section by section comparison:
Loan Option 1:
Loan Option 2:
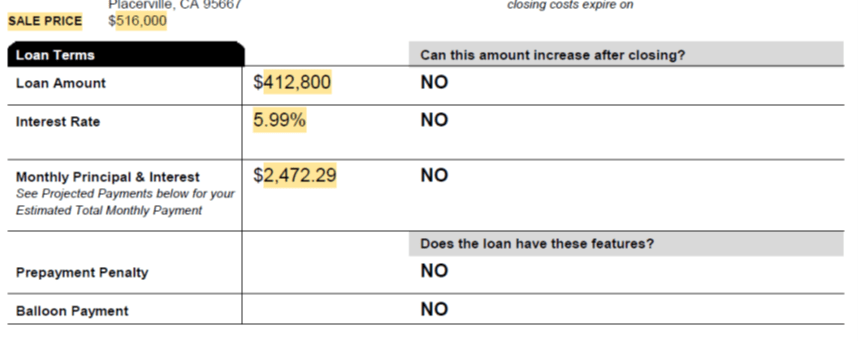
So far, so good, right? They look identical.
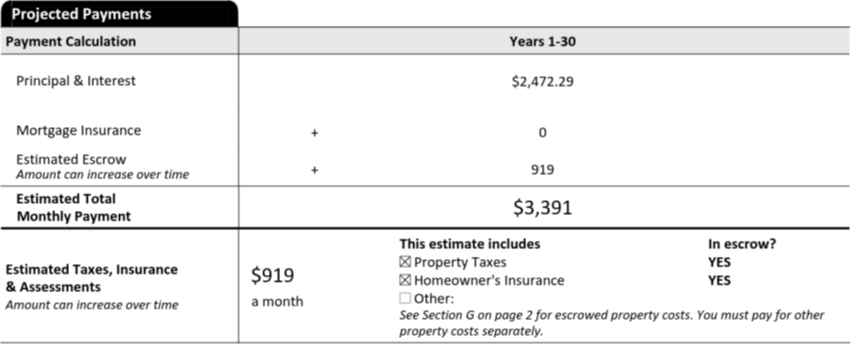
Then you review the Payment Summary.
Loan Option 1:
Loan Option 2:
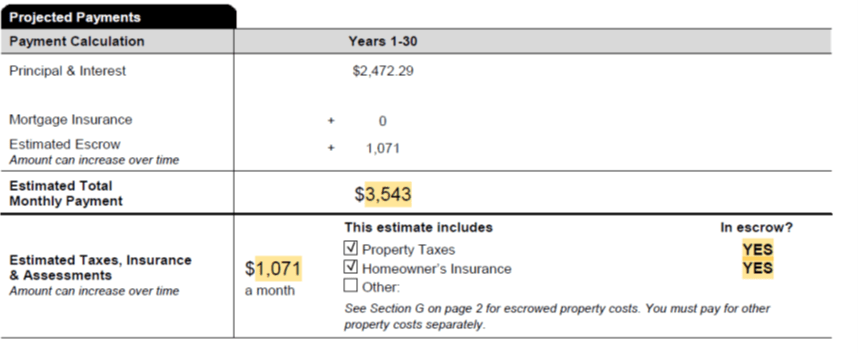
Here you might notice that Loan Option 2 has a higher total payment of $3543 vs. $3391 for Loan Option 1. Wait a minute! You’d prefer the lower payment, right? But there’s more to that story, I’ll get to below. It’s important.
Then you compare the summary for Closing Costs and Estimated Cash to Close.
Loan Option 1:
And Loan Option 2:
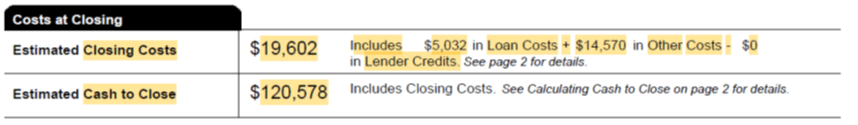
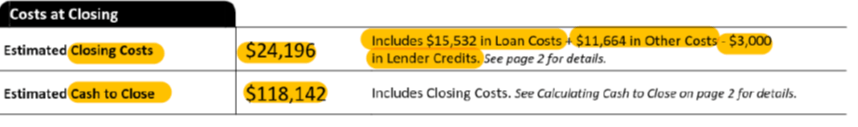
Well that’s interesting, right? Loan Option 1 has total costs of $24,196 compared to Loan Option 2 which only has total costs of $19,602, but the total cash to close is lower on Loan Option 1. If you only looked at the interest rate and bottom line cash to close, you might think Loan Option 1 is better. But it’s not.
Additionally, it’s important to understand that in the Estimated Closing Costs, the summary includes both the actual transaction costs aka Loan Costs, AND the costs of owning the home, including property taxes, homeowners’ insurance and prepaid interest on the new loan, which are called, somewhat misleadingly “Other Costs”. I would have preferred our regulators call them “Costs of Owning Your Home” but they didn’t listen to me, despite my best efforts. Those “Other Costs” are items you’re paying regardless of your loan. Interest, property taxes and homeowners’ insurance, you’re paying regardless.
The final piece in that summary is the Lender Credit, where Loan Option 1 has $3000, and Loan Option 2 has zero.
Now, let’s get to Page 2. That’s where all is revealed. Page 2 shows your Closing Cost Details.
Loan Option 1:
Loan Option 2:
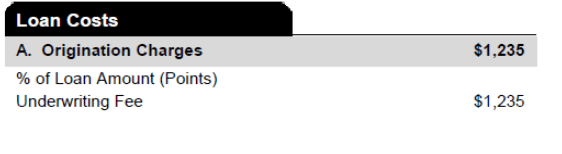
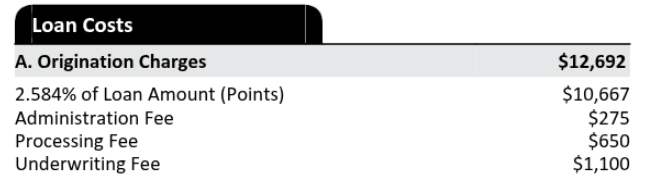
Box A is where the magic happens. This is where your lender’s direct costs live. Some lenders will have a bunch of additional fees baked into your costs here. We do not.
As you can see here, Loan Option 2 has only $1235 in Loan Costs (which should be titled Lender Costs, because those go to the lender whereas other “loan costs” do not) compared to Option 1 which has $12,692. Obviously, Loan Option 2 is better. By about $11,000. So why was their cash to close less than Option 2? I’ll get to that later.
Next, let’s look at Box B. Box B consists of pass-through charges to third party providers that you cannot shop for and should be estimated as closely as possible to actual fees for those services.
Loan Option 1:
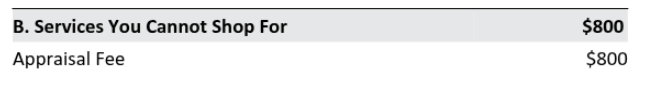
Loan Option 2:
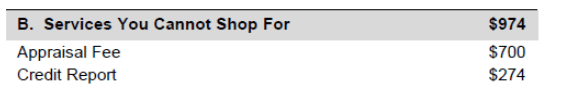
Loan Option 1 saves $174, because they’re choosing to not pass along the credit report fee. Or, they forgot to include the fee. In this case, the borrowers are not married, so they each need their own credit report, which is why the fee is $274 for loan Option 2.
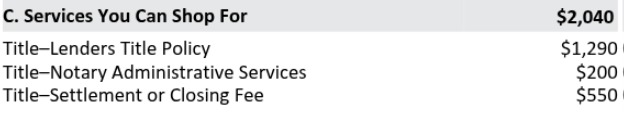
Box C is similar to Box B, in that they are for third party services, but you CAN shop for them, if you like. Or, you can take the suggestion of your realtor, the seller’s realtor, or your lender. One key difference, however, is that if you are not using the lender’s chosen service provider, then these fees can change from the original estimate to your final closing figures. Whereas if you choose to work with whomever the lender suggests, they cannot vary. That’s a very important distinction.
Loan Option 1:
Loan Option 2:
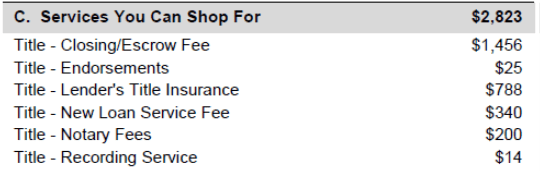
As you’ll see, both include Lender’s Title Policy, which is the title insurance protecting the lender. Both figures are reasonable. Both estimate $200 for notary services. Loan Option 1 has a Settlement Fee, but it’s only $550 vs. Loan Option 2, which has a $1456 closing/escrow fee. That’s a big difference. Personally, if I saw Loan Option 1’s estimate, I’d think that $550 is a little low for a closing/escrow fee on a $516,000 purchase. Many title/escrow service providers also have a loan tie-in fee and a recording service fee. Some may not. But again, these costs are what they are, based upon whoever provides those services. At EZ Mortgages, we try to make those estimates as accurate as possible, even when you aren’t using our chosen providers.
Now we move into the “Other Costs” section, which includes boxes E for government fees – why those aren’t considered part of your closing costs boggles my mind, but that’s how they did it. Boxes F, and G are costs of owning your home, including interest, property taxes and homeowner’s insurance. And Box H is for “other costs” where Owners’ Title Insurance lives. I’m not sure why they didn’t include this in box C with the other title/escrow services, but whatever.
Comparing these two estimates, Loan Option 1:
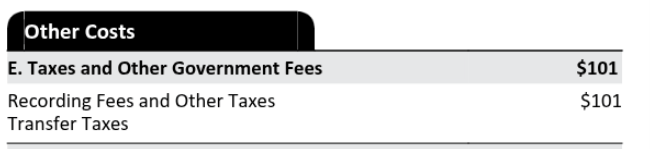
Loan Option 2:
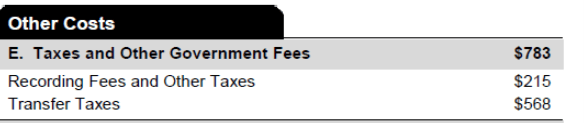
Again, the $101 recording fee estimate is a little low, at least for California and many other States. Transfer taxes should be listed if they apply, as they do in California, even if the seller is paying them. Some states don’t have transfer taxes, so perhaps the loan officer with Option 1 just forgot them?
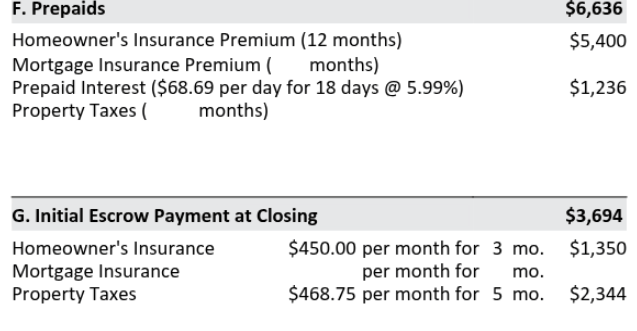
And for Boxes F and G, which are costs of owning your home, Loan Option 1:
Loan Option 2:
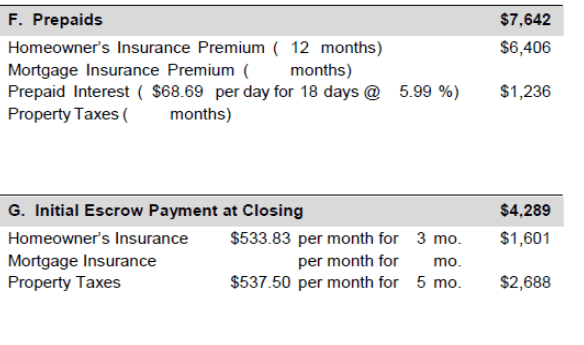
In box F, you’ll notice Loan Option 2 shows higher costs. But, those will be what they are regardless of your loan. They are just estimates here. The first year of homeowners’ insurance will be paid up front at closing at whatever the cost is for the policy and coverage you choose. Loan Option 1 estimated $450/mo (as you can see in Box G) and Loan Option 2 estimated $533.83/mo. But that’s your choice for whatever homeowners’ insurance you find. So, at closing, that number would be the same, no matter what loan or lender you chose.
Same thing for the per diem interest. Since both estimates are at 5.99% with the same loan amount, the per diem interest will be the same, based on the actual closing date, vs. what’s estimated up front. Both estimated closing on the same day, so they had the same 18 days of prepaid interest.
In Box G that’s what’s used to fund your impound account, if you have one. The only variance here is the difference in estimated homeowners’ insurance and property taxes. We typically estimate 1.25% of a purchase price for property taxes, in California. In California, the base rate per county is 1%, but there are special assessments for roads, schools or whatever that can add a bit more, so we use 1.25% to cover them.
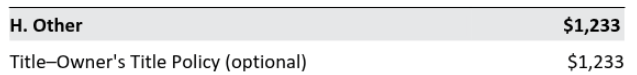
Box H has the Owners’ Title Insurance. Loan Option 1:
Loan Option 2:
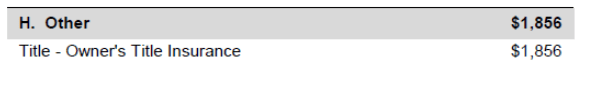
Again, that’s a third party service fee that is passed through, so they are what they are. It appears to me that Loan Option 1 may have estimated a little low.
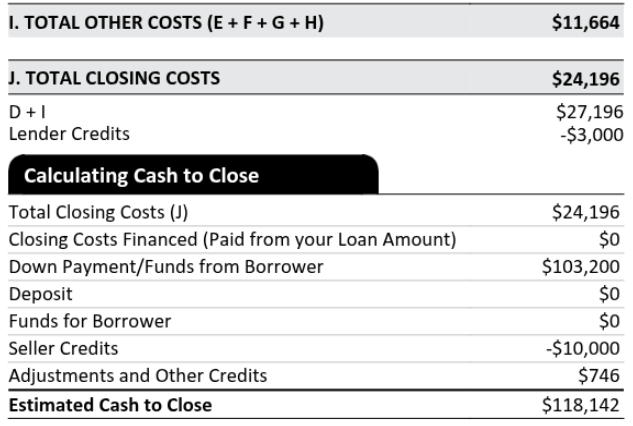
And lastly, the final summary. Loan Option 1
Loan Option 2:
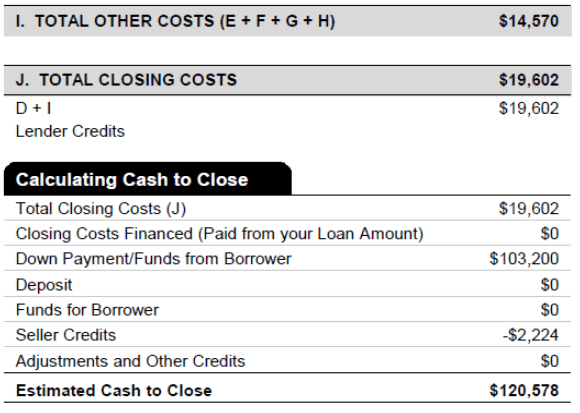
Here you may notice that Box I “Total Other Costs” is $11,664 in Loan Option 1, vs. $14,570 in loan option 2. So you may wonder, why would I choose Loan Option 2? Those costs are higher.
But it’s important to remember that those are basically costs of owning your home. They are interest, taxes and insurance (and they do include recording fees and transfer taxes too from Box E). So at the end of the day, those will be the same, regardless of the loan you choose.
Looking at Total Closing Costs in box J is a little helpful. You can see that Loan Option 1 is $24,196 compared to just $19,602 in Loan Option 2, so it’s $4500 less in Loan Option 2. But that still hides some of the detail I’ve pointed out above.
Go back and compare only boxes A for each option. You see Loan Option 1 is $12,692, vs. Loan Option 2, which is only $1235. There’s your savings. Loan Option 2 is about $11,457 less costly than Loan Option 1.
So why is the cash to close lower for Loan Option 1? They included a $10,000 seller credit that may or may not be included in their final purchase agreement. Loan Option 2 does not include that seller credit. Rather, it estimates that the seller will pay roughly $2224 for their portion of the title/escrow and transfer taxes that are common for a seller to pay for a purchase in El Dorado County, as negotiated within your purchase agreement. The other part of the difference is just the other variances in boxes E, F and G, which are? Costs of owning your home! Those don’t really change, regardless of the loan you choose. Along with another little variance in Box H in the estimated Owners’ Title Insurance premium.
I hope you found that helpful, even if a bit long!
Here’s how rates ended this week. Have a great weekend.
| Conforming | Rates | Points | APR | Loan Amt | Payment | ||||
| 30 yr fixed mortgage | 6.125% | 0 | 6.175% | $ 300,000.00 | $ 1,823 | ||||
| 15 yr fixed mortgage | 5.625% | 0 | 5.675% | $ 300,000.00 | $ 2,471 | ||||
| 30 Yr fixed FHA mtg | 5.875% | 0 | 6.725% | $ 300,000.00 | $ 1,775 | ||||
| 30 Yr fixed VA mtg | 5.990% | 0 | 6.420% | $ 300,000.00 | $ 1,797 | ||||
| Jumbo (ask me about Super Conforming limit, per your zip code) | |||||||||
| 30 yr fixed mortgage | 5.875% | 1 | 6.051% | $ 1,200,000.00 | $ 7,098 | ||||
| 15 yr fixed mortgage | 5.500% | 1 | 5.738% | $ 1,200,000.00 | $ 9,805 | ||||
| 5/6 ARM | 5.375% | 1 | 5.638% | $ 1,200,000.00 | $ 6,720 | ||||
| 10/6 ARM | 5.750% | 1 | 5.891% | $ 1,200,000.00 | $ 7,003 | ||||
| Rates subject to change without notice. | |||||||||
| Please keep in mind, these rates and statistics are for informational purposes only to give you a sense of market movement and my opinion as to why. Although these rates exist today, based on certain qualifying characteristics (780+ fico, owner occupied SFR with 75% loan to value ratio or less and $200,000+ loan amount), your scenario may allow for lower or higher interest rates. Licensed by the CA Dept of Real Estate, #01760965. NMLS: 239756. Equal Opportunity Housing Lender. If you’d like to be removed from this list, please reply with REMOVE in the subject line. You can also use this link, mailto:eric@ezmortgages.us and add REMOVE to the subject line. To add someone who would appreciate this information, send me their email with SUBSCRIBE as subject. | |||||||||